.svg)


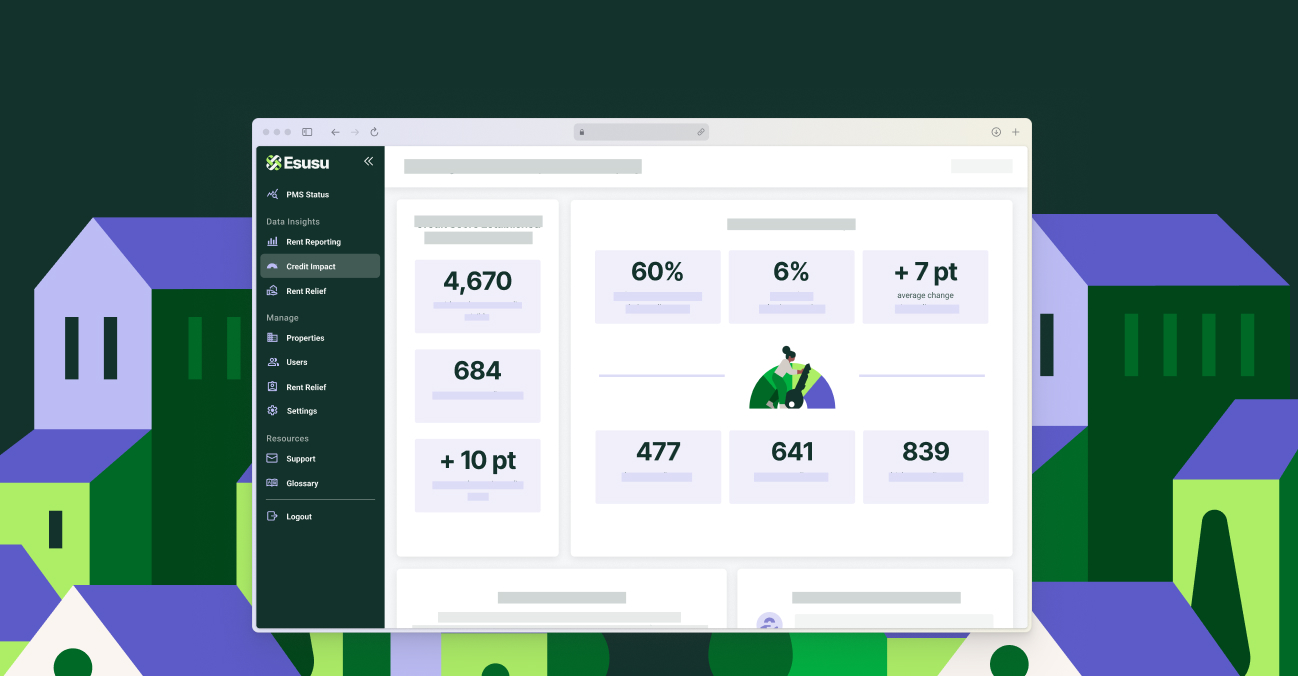
The Esusu Dashboard is designed to help property owners and managers monitor portfolio health, analyze rent reporting impact, and share key insights with stakeholders more easily. Instead of treating reporting as a static back-office task, the dashboard gives teams a central hub for tracking resident impact and property-level performance across a portfolio.
Better visibility across your portfolio
As portfolios grow, it becomes more important to see multiple properties at once and quickly understand what is happening across teams and communities. The Esusu Dashboard is built to make that easier by giving owners and managers more visibility into the data that matters most.
That includes metrics tied to rent reporting participation, resident impact, and broader portfolio health. The goal is not just to collect data, but to make it easier to turn that data into action.
Reporting tools that are easier to configure and share
One of the strongest parts of the Esusu Dashboard is the ability to customize what you see. Teams can choose which data points matter most to them and build reports around the KPIs they actually use.
The dashboard also supports PDF and CSV exports, which makes it easier to share reports across the organization, even with stakeholders who do not log in regularly.
We have also added download functionality for Property, Portfolio, and Resident impact metrics, making it easier for owners and operators to pull reporting directly from the dashboard when needed.
Stay current with refreshed data and alerts
The dashboard experience now includes a more structured reporting rhythm. We have monthly refreshes and update notifications so owners and property managers can stay on top of the latest impact metrics without needing to manually check for changes every time.
That makes it easier to keep leadership teams, investors, and operating partners informed with current data instead of stale snapshots.
Place-based insights through Potomac X Lafayette Square
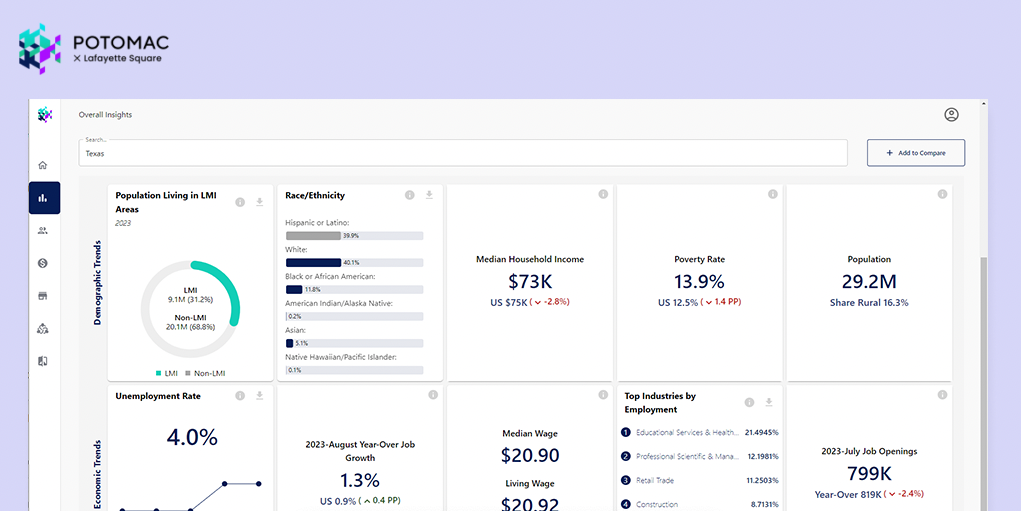
The Esusu Dashboard also gives properties access to Potomac X Lafayette Square, a place-based analytics platform that provides socioeconomic insights at the regional and portfolio level. Through that integration, teams can view data like median income, homeownership rates, and other indicators that help contextualize resident and market conditions.
For properties using Esusu, this platform has been positioned as a free resource accessible through the dashboard.
That makes it especially useful for organizations trying to understand not just property performance, but the broader economic environment shaping resident outcomes.
New tools that improve portfolio management
We have continued expanding the dashboard beyond the original launch. More recent product updates have introduced features like:
- Groups, which help organize properties and streamline portfolio-level analysis;
- The PII Gap Report, which helps property managers identify residents missing key data like SSN or DOB so eligible renters can be reported more accurately to the credit bureaus;
- And additional visibility into enrolled residents and unreported renters through newer dashboard updates.
These updates show that the dashboard is not just a reporting portal. It is becoming a more operational tool for managing rent reporting quality, portfolio insights, and internal coordination.
How the Esusu Dashboard helps your business
In any market, it helps to have reporting that is easy to configure, easy to access, and easy to share. The Esusu Dashboard supports that by making it easier to align teams around the same data, set KPIs across portfolios, and communicate results internally and externally.
It also gives owners and operators more control over how insights are viewed and delivered across the organization. That means clearer communication, stronger reporting, and faster access to the metrics that support decision-making.
Want to know more?
If you are already working with Esusu and want help navigating the dashboard, contact your account manager.
If you want to learn more about bringing Esusu’s reporting and analytics tools to your portfolio, email sales@esusu.org.